
Recruitment Statistics India 2027: The Verified Numbers Behind Your Hiring Plan
Hiring outlook, talent shortage, time to fill, pay and attrition, each with its source, sample and date.
India's hiring outlook is 54%, 82% of employers report a talent shortage, pay is projected to rise 9.1% and attrition is 18%. The sourced numbers for a 2027 hiring plan.

TL;DR
The recruitment statistics India hiring teams need for 2027 planning all point the same way: demand is strong, skilled supply is tight, and keeping people is getting more expensive. ManpowerGroup's Q4 2026 survey puts India's Net Employment Outlook at 54%, the highest of 42 countries, while 82% of Indian employers say they struggle to find skilled talent, and Aon projects 9.1% salary increases for 2027 after measuring 18% attrition in 2026. Every figure here is dated and sourced, and none is a 2027 measurement, because none exists yet. For what these numbers do to spend, see our line by line guide to recruitment budget planning.
What is actually happening
Employer intent in India is the strongest in the world right now. ManpowerGroup surveyed 3,055 Indian employers in July 2026 and reported a seasonally adjusted Net Employment Outlook of 54% for Q4 2026, up 6 points on the previous quarter and 11 points on the previous year. The global average across 42 countries was 29%. In India, 65% of employers expected to add staff, 24% expected no change, and 11% expected to cut.
The reason behind that intent matters more than the headline. Among Indian employers planning to add people, 69% said the driver was changing roles and skill requirements, against 62% globally. That is not classic expansion hiring. It is companies buying skills they do not have.
Job posting data tells a calmer story. The Naukri JobSpeak index stood at 3,053 in September 2026 against 3,002 a year earlier, a rise of 2%. October then showed 2,836 against 2,480, a rise of 14%, but Diwali fell in October last year, which made the comparison base unusually soft.
Inside that index, the split is sharp. IT and software services hiring was down 4% in September and up 5% in October, while AI and machine learning roles rose 20% and then 32%. Global capability centres moved from 4% growth to 18%, and automobile hiring from 11% to 36%.
Staffing data agrees on direction. TeamLease's Employment Outlook for the second half of FY27, built from 1,239 employers in 23 industries and 20 cities, projects net employment change of 5.4%, up from 4.7% in the first half. E-commerce and tech startups lead at 12.6%, followed by travel and hospitality at 12.3% and retail at 10.3%.
The wider labour market is steady. The government's PLFS monthly bulletin for September 2026 puts unemployment for people aged 15 and above at 5.0%, with urban unemployment at 6.9% and female labour force participation at 34.6%. A steady headline rate and a skills shortage can both be true, and in India right now they are.
The numbers
These are the figures worth carrying into a 2027 hiring plan, grouped by the question they answer. Each one names its source and the period it measures.
What is the hiring outlook in India right now?
India's hiring outlook is the strongest of any country ManpowerGroup surveys: a Net Employment Outlook of 54% for Q4 2026, against a global average of 29%. TeamLease projects net employment change of 5.4% for October 2026 to March 2027. Naukri's job posting index grew 2% in September 2026 and 14% in October 2026.
- 54%: India's Net Employment Outlook, Q4 2026 (ManpowerGroup, 3,055 employers, surveyed July 2026).
- 65%, 24%, 11%: share of Indian employers planning to add staff, hold, or cut in Q4 2026 (ManpowerGroup).
- 5.4%: projected net employment change, H2 FY27, up from 4.7% in H1 (TeamLease, 1,239 employers).
- 68%, 61%, 60%: hiring intent in Bengaluru, Hyderabad and Pune, H2 FY27 (TeamLease).
- 66%, 59%, 53%: share of large, medium, and small or startup employers planning to expand (TeamLease).
- 2% and 14%: year on year growth in white collar job postings, September and October 2026 (Naukri JobSpeak).
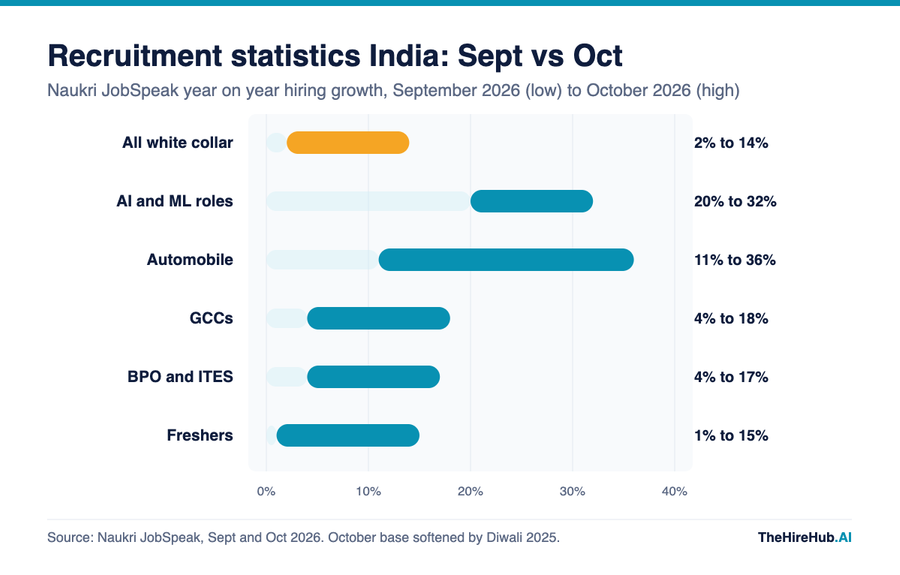
How to read this chart:
- Each bar runs from the September 2026 reading to the October 2026 reading for the same segment of the same index.
- The amber bar is the headline number. It moved from 2% to 14% in one month, mostly because of where Diwali fell in 2025.
- Segments that were already growing fast in September (AI and machine learning) are the ones to trust as real demand.
How hard is it to find skilled talent in India?
Very hard, by employers' own account. In ManpowerGroup's 2026 Global Talent Shortage Survey, 82% of Indian employers said they struggle to find the skilled talent they need, level with the global average across 41 countries. TeamLease found 72% of employers planning to grow expect moderate to significant hiring difficulty.
- 94%: automotive employers in India reporting talent shortage, the highest of any sector (ManpowerGroup, fieldwork October 2025).
- 85%: finance and insurance employers reporting shortage, and the same in the information sector (ManpowerGroup).
- 79%: manufacturing employers reporting shortage, and 76% in hospitality, the lowest sector readings (ManpowerGroup).
- 39%, 38%, 32%: employers naming IT, sales and marketing, and engineering as the hardest functions to hire (TeamLease).
- 35 to 45 days: average time to fill reported by employers, longer for specialist and site based roles (TeamLease).
- 56.35%: share of tested graduates rated employable, up from 54.81% a year earlier (India Skills Report 2026, published November 2025).
How much are salaries rising in India in 2027?
Aon's Annual Salary Increase and Turnover Survey, released on 14 October 2026 and covering more than 1,200 organisations in 45 industries, projects an average increase of 9.1% for 2027 against an actual 9% in 2026. This is a named projection from Aon, not a measurement.
- 18%: attrition in 2026, up from 16.2% in 2025 and 17.1% in 2024 (Aon).
- 10.1%: projected 2027 increase at non banking financial companies, the highest sector (Aon).
- 6.6%: projected 2027 increase in technology consulting and services, the lowest sector, unchanged from 2026 (Aon).
- 9.4%: projected 2027 increase at global capability centres, and the same in retail (Aon).
- About 10%: rise in pay premiums for AI, machine learning and data science roles compared with 2025 (Aon).
Sources and method
Every figure comes from a primary release checked in November 2026: ManpowerGroup's Q4 2026 Employment Outlook Survey and 2026 Talent Shortage Survey, TeamLease's H2 FY27 Employment Outlook (as reported by Business Standard on 24 September 2026), Naukri JobSpeak for September and October 2026, the PLFS bulletin for September 2026, Aon's survey of 14 October 2026, and the India Skills Report 2026. The figures cover organised, mostly white collar employment. They do not cover informal work, and no source here publishes a verified national cost per hire or a time to hire by role.
How it actually works, and where it breaks
Recruitment statistics come from four kinds of instrument, and they measure different things. Intent surveys (ManpowerGroup, TeamLease) ask employers what they plan to do. Posting indices (Naukri JobSpeak) count new job listings on one platform. Household surveys (PLFS) ask people whether they are working, and compensation surveys (Aon) ask HR teams what they paid and who left.
That difference explains most of the apparent contradictions. A 54% outlook and a 2% rise in postings are not in conflict, because the first counts employers and the second counts listings. Three failure modes cause most of the bad decisions.
- Base effects. October's 14% is real arithmetic and a poor guide to demand. The index itself fell from 3,053 in September to 2,836 in October.
- Intent is not headcount. A Net Employment Outlook is the share of employers planning to hire minus the share planning to cut. It says nothing about how many people each will hire.
- Unsourced benchmarks. Tables of time to hire by role and cost per hire by level circulate widely with no survey behind them. The only sourced speed figure in this article is TeamLease's 35 to 45 day average.
How do you check a recruitment statistic?
Ask four things before a number goes into a plan: who measured it, when the fieldwork happened, how many employers or people were in the sample, and what unit it counts. If a page cannot answer all four, treat the figure as an opinion. A statistic with a date and a sample beats a rounder one without.
- Who: a named survey or index, not "industry research".
- When: the fieldwork month, which is often 6 to 12 months before the headline year.
- How many: 3,055 employers is a survey. Twelve customers is an anecdote.
- What unit: employers, listings, people, or rupees. Mixing them produces nonsense.
"A recruitment statistic without a date, a sample and a unit is not evidence, it is somebody's opinion wearing a number."
What this means for your team
Use the market numbers in sequence, because each one sets a different line of the 2027 plan. Demand tells you how contested your roles will be, supply tells you where to build instead of buy, speed sets your start dates, pay sets your offer bands, and attrition sets your backfill volume.
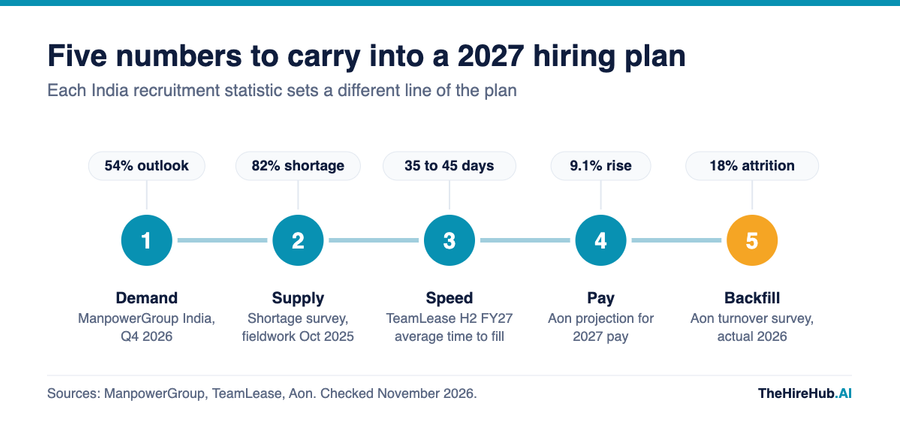
A worked example makes the sequence concrete. Take a 400 person company that expects to lose people at the market rate Aon measured and to grow in line with TeamLease's net employment reading.
- Backfill first. At 18% attrition, 400 people means 72 leavers to replace before any growth.
- Then growth. Net growth of 5.4% adds about 22 roles, so the plan is roughly 94 hires, and three quarters of them are replacements.
- Then time. At 35 to 45 days to fill, a role approved on 1 February is realistically filled in mid March, before any notice period.
- Then pay. A 9.1% average increase applies to the existing payroll, and AI and data offers carry a premium on top.
These are market averages applied to an invented company, so replace each input with your own figure where you have one. The point of the exercise is the shape: most of next year's hiring is already decided by this year's exits. The 85% of employers that TeamLease found using some AI, with only 13% using it across more than half their workforce, face the same arithmetic, and our AI recruiting adoption analysis covers what the deeper adopters do differently.
Recruitment statistics vs your own hiring data
Market statistics and internal metrics answer different questions. Market statistics tell you what the environment will do to you: how many competitors are hiring, how scarce a skill is, what pay movement to expect. Internal data tells you how well your own process converts that environment into hires.
Neither substitutes for the other. A national time to fill of 35 to 45 days cannot tell you why your engineering roles take 70, but your own stage data can, which is what our recruitment funnel conversion rates benchmarks are for. Use market numbers to set assumptions and your own numbers to set targets, and check speed against time-to-hire benchmarks before promising a start date to a hiring manager.
How to actually do this (and the four traps)
Build a one page statistics sheet for your 2027 plan: six to ten numbers, each with source, date and the decision it informs. Refresh it quarterly when ManpowerGroup and Naukri publish. Then avoid these four traps.
- Quoting a single month. One JobSpeak reading can swing 12 points on a festival date. Use at least two consecutive months, or the financial year figure.
- Treating a projection as a fact. Aon's 9.1% is a projection for 2027 and TeamLease's 5.4% is employer intent. Label them that way in your deck so nobody budgets against them as outcomes.
- Borrowing a global benchmark for an India plan. United States cost and speed figures do not transfer, and India has no audited national equivalent. Our cost per hire benchmarks guide explains what can be compared and what cannot.
- Planning growth and forgetting exits. At 18% attrition, a team that plans only for new roles will miss its hiring number in the first quarter. Put backfill volume on the first line.
"Most of next year's hiring was decided by the people who left this year, long before anyone approved a new role."
The one thing every hiring leader should take from this
If you are finalising a 2027 plan this month, the statistics say one thing clearly: the constraint is skills and retention, not the number of open roles. India has the strongest employer intent in the world, a talent shortage reported by 82% of employers, pay rising about 9%, and nearly one in five employees leaving each year. Plan backfill before growth, date every number you quote, and re-check the plan each quarter as new releases land. At TheHireHub this is the arithmetic behind most hiring plans we see, and if you want a second pair of eyes on yours, we look at this stuff all day.
Frequently Asked Questions
The latest reading is ManpowerGroup's Net Employment Outlook of 54% for Q4 2026, the highest of 42 countries surveyed and well above the 29% global average. TeamLease projects net employment change of 5.4% for October 2026 to March 2027. Both are employer intent measured in mid 2026, not a forecast of 2027 outcomes.
Aon's Annual Salary Increase and Turnover Survey, released on 14 October 2026, projects an average increase of 9.1% for 2027, against an actual 9% in 2026. Non banking financial companies are projected highest at 10.1% and technology consulting and services lowest at 6.6%. It is a projection from one survey of more than 1,200 organisations.
Aon measured attrition at 18% in 2026, up from 16.2% in 2025 and 17.1% in 2024. At that rate a 400 person company replaces about 72 people a year before adding any new roles, which is why backfill should be the first line of a hiring plan.
In ManpowerGroup's 2026 Global Talent Shortage Survey, 82% of Indian employers said they struggle to find the skilled talent they need, the same as the global average. Automotive employers reported the highest shortage at 94%, and hospitality the lowest at 76%. Fieldwork was completed in October 2025.
TeamLease's Employment Outlook for the second half of FY27 reports an average time to fill of 35 to 45 days, longer for specialist and site based roles. There is no audited national benchmark by role or seniority, so treat role level tables without a named survey as estimates.
By employer intent, TeamLease ranks e-commerce and tech startups first at 12.6% net employment change for H2 FY27, then travel and hospitality at 12.3%, retail at 10.3% and automotive at 10.1%. In Naukri's job posting data, AI and machine learning roles grew 20% in September 2026 and automobile hiring 11%.
TeamLease's H2 FY27 survey puts Bengaluru first with 68% hiring intent, followed by Hyderabad at 61% and Pune at 60%, with Pune showing the largest gain. Naukri's September 2026 posting data also had Hyderabad leading the metros at 9% growth, while Delhi NCR and Mumbai each declined 6%.
Unevenly. Naukri JobSpeak showed IT and software services hiring down 4% year on year in September 2026 and up 5% in October 2026, a month flattered by the Diwali base. Within IT, AI and machine learning roles grew 11% in September. Aon projects the lowest 2027 pay increase, 6.6%, in technology consulting and services.
Nobody has 2027 data yet. What current sources indicate is continued skills led demand, pay increases of about 9%, attrition near 18%, and wider but shallow AI use: TeamLease found 85% of employers using some AI but only 13% across more than half their workforce. Re-check each figure as quarterly releases arrive.
The PLFS monthly bulletin for September 2026, released on 15 October 2026, puts unemployment for people aged 15 and above at 5.0%, with 4.2% in rural areas and 6.9% in urban areas. The labour force participation rate was 55.5% overall and 34.6% for women.

