
Cost Per Hire Benchmarks in 2026: What Hiring Actually Costs in India and Globally
The published averages are a floor, not a target, and the gap between the two is where most hiring budgets quietly leak.
Cost per hire in India runs ₹30,000 to ₹70,000 for most roles against a US average of $5,475. Here is the channel by channel breakdown and what the benchmark hides.

TL;DR
Cost per hire benchmarks sit at $5,475 for a non-executive role in the United States and roughly ₹30,000 to ₹70,000 for most roles in India, and both figures are floors rather than targets. The published number counts direct spend such as job boards, agency fees, recruiter time and background checks, then quietly leaves out interviewer panel hours and the cost of the seat sitting empty. Add those back and the real figure often doubles. Before you argue about cost, look at speed, because it drives most of this spend: our time to hire benchmarks post covers the metric underneath the money.
What is actually happening
The number everyone quotes has a specific source and a specific date. SHRM released its 2025 Benchmarking Report on 15 October 2025, putting average cost per hire at $5,475 for non-executive positions and $35,879 for executive ones. That makes an executive hire nearly seven times more expensive than a regular one. There is no separate 2026 SHRM figure yet, so anyone quoting one is restating the October 2025 number.
It has moved less than you would expect: SHRM's Human Capital Benchmarking Report for fiscal 2015 put the figure at $4,129. By April 2022 SHRM was reporting "nearly $4,700". The 2025 jump to $5,475 is a rise of about a third across a decade. Recruiting has become dramatically more automated in that window, and the headline cost went up anyway.
India runs on a different structure entirely, because the dominant external cost is priced as a percentage of salary rather than as a flat fee. The standard contingency agency fee is 8.33% of annual CTC for entry level and bulk roles, which is exactly one month's salary. Mid level and specialised roles typically go to 12.5%, and senior or niche roles to 16.67%. On a ₹15 lakh CTC hire that is a spread of ₹1.25 lakh to ₹2.5 lakh for the same seat.
Everything else in the Indian stack is cheap by comparison. Naukri lists job postings at ₹400 for a Standard slot, ₹850 for Classified and ₹1,650 for a Hot Vacancy, per posting per month. Resdex database access starts around ₹55,000 for three months. Background verification runs ₹500 to ₹8,000 per candidate depending on depth, with standard identity, education, employment and criminal packages landing near ₹800 to ₹1,500.
Put those together and the picture is uncomfortable for anyone building a budget. One line item, the agency fee, is frequently larger than every other recruiting cost combined. That single fact explains most of what talent acquisition teams argue about in planning season, and it is why the blended benchmark is close to useless for decision making.
The numbers
Here is the same ₹15 lakh CTC role, priced four different ways. The job board figure assumes published Naukri rates plus an amortised share of a Resdex subscription. The referral band reflects published Indian programme amounts, which cluster between ₹30,000 and ₹50,000 for junior and mid level engineers and ₹50,000 to ₹80,000 for senior and product roles.
TCS raised its referral incentive to ₹40,000 to attract mid level tech talent, which sits neatly in the middle of that band. The in-house recruiter figure is the only modelled one here rather than sourced: a loaded recruiter at ₹12 lakh to ₹18 lakh closing 20 to 35 hires a year.
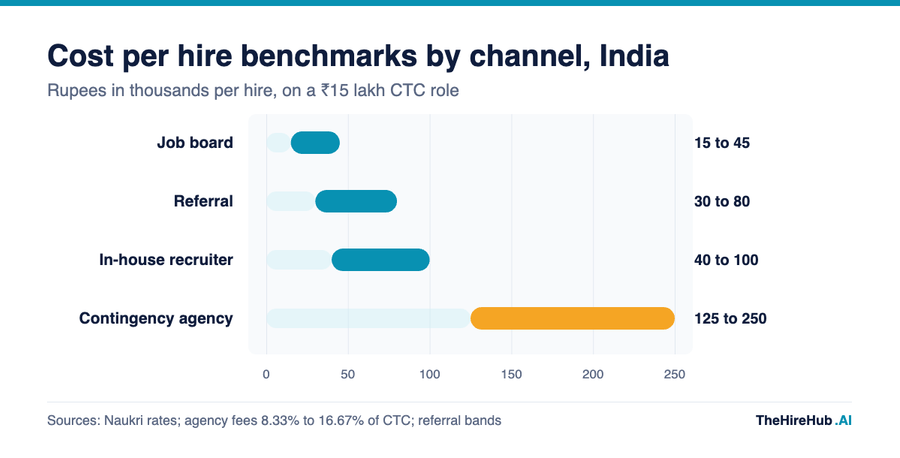
How to read this:
- The bands overlap for everything except agency, which sits in its own tier. Any conversation about cutting cost per hire that does not start with channel mix is decoration.
- The in-house recruiter band is the only one that gets cheaper with volume. Agency fees scale linearly with hires, and with salary, forever.
- None of these bars include interviewer time, hiring manager hours, or the revenue lost while the role is open. Those are excluded from the benchmark by definition.
How it actually works, and where it breaks
The formula behind the benchmark is the ANSI and SHRM standard, CPH-001. Total external cost plus total internal cost, divided by the number of hires in the period. External means job boards, agency and search fees, background checks, relocation and career fairs. Internal means recruiter and sourcer time, referral bonuses, and your ATS and tooling spend.
That definition is honest about what it is. It is a direct-spend measure, and it explicitly does not include interviewer panel time at most companies, hiring manager hours, candidate travel, vacancy cost, onboarding, or the cost of a mis-hire. It is the floor of what a hire costs your business, and it is often less than half of it.
The first failure mode is the denominator. Teams count offers rather than joins, or include backfills alongside new headcount, or quietly drop the two hires that fell through in week three. Every one of those choices moves the number by more than any process improvement will. If two people in your company compute cost per hire and get different answers, this is almost always why.
The second failure mode is the numerator. Most Indian teams report cost per hire as external spend only, because that is what shows up on an invoice. Recruiter salary is sitting in the HR cost centre, panel hours are invisible, and the resulting number flatters an in-house team that may in fact be more expensive than the agency it replaced. Excluding the largest internal cost from a cost metric is not conservatism, it is a category error.
The third failure mode is averaging across populations that behave nothing alike. A company doing 200 support hires and 12 senior engineering hires has two completely different cost structures. Blending them produces a number that describes neither, and every decision made from it will be wrong for at least one of the two groups.
"A cost per hire number that excludes the hours your engineers spend in interviews is not a measurement, it is a budget line."
What this means for your team
You do not need a project to fix this. You need about three weeks of unglamorous work and then a quarterly habit. The sequence below is deliberately boring, because the failure mode is almost never sophistication, it is inconsistency between two quarters.
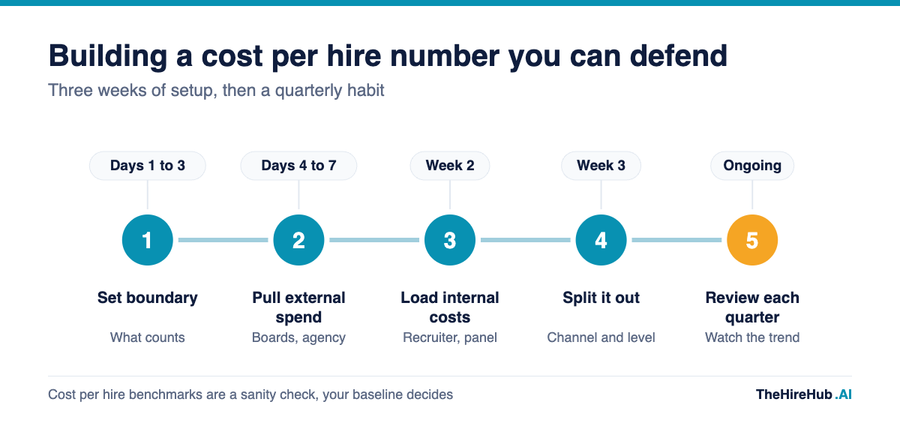
The two steps people skip are the first and the last. Setting the boundary means writing down, in one paragraph, which costs count and what a hire is. Reviewing quarterly means the number becomes a trend rather than a slide. A single quarter's cost per hire tells you very little; four quarters tells you whether your channel mix is working.
The output you want at the end is not one figure. It is a small table: cost per hire by channel, by seniority band, with the count of hires next to each. That table answers budget questions. A single blended average does not.
Cost per hire benchmarks vs your own baseline
The benchmark and the baseline do different jobs, and confusing them is the most common mistake in this area. A benchmark is a national blended average across every industry, company size and role type. It is useful for one thing: telling you whether you are in a wildly different universe from everyone else. It cannot tell you whether ₹1.8 lakh for a backend engineer was a good trade.
Your baseline can. Your own number from last quarter, split by channel, compared against the same split this quarter, is the only comparison that can actually change a decision. It controls for your industry, your salary bands, your location and your process, none of which the benchmark controls for. If you are choosing which metrics to stand up first, our guide to the recruitment metrics every startup should track is a reasonable starting set, and if the question is really about tooling spend rather than total cost, AI recruiting software cost covers the pricing side directly.
How to actually do this (and the four traps)
- Counting offers instead of joins. An offer is not a hire. If you divide by offers extended, your cost per hire improves every time a candidate declines, which is the exact opposite of what you want the metric to reward. Divide by people who actually started, and hold that definition steady even in a bad quarter.
- Leaving recruiter salary out of the numerator. If your in-house team is not in the cost, you are comparing an agency's full price against your own marginal price. That comparison always favours in-house, and it is wrong often enough to be dangerous. Load the recruiter cost, load the tooling, and only then compare, which is the honest version of the AI recruiting vs agency question.
- Reporting one blended number. Split by channel and by seniority band before anyone sees it. If leadership only ever sees the blend, you will get asked to cut a number that is already being dragged around by three senior hires you had no choice about.
- Chasing the benchmark down instead of the outcome up. Cost per hire is trivially easy to improve by hiring worse people faster. It is the metric most vulnerable to being gamed into harm, which is why it should never be read without a quality signal beside it. Our breakdown of the real cost of a bad hire covers what the downside actually looks like, and it is larger than anything you will save on job board spend.
"The only benchmark that can change a decision is the one you measured yourself, last quarter, using the same definition."
The one thing every hiring leader should take from this
If you take one thing from this, take the boundary, not the benchmark. The $5,475 and the ₹30,000 to ₹70,000 are useful as a sanity check and nothing more, because both were computed with a definition that almost certainly differs from yours. What changes outcomes is writing down what counts, applying it identically every quarter, and splitting the result by channel and seniority so it can survive contact with a CFO. Do that for four quarters and you will have something no benchmark can give you, a number that is actually about your company, and if you want to compare notes on how other teams structure this, we look at this stuff all day.
Frequently Asked Questions
The most recent published benchmark is $5,475 for a non-executive role and $35,879 for an executive role, from the 2025 SHRM Benchmarking Report released on 15 October 2025. There is no separate 2026 SHRM figure yet, so that is the number to plan against. In India, most roles land between ₹30,000 and ₹70,000 in direct spend, with agency-sourced hires running far higher.
The ANSI and SHRM standard, CPH-001, defines it as total external recruiting cost plus total internal recruiting cost, divided by the number of hires in the period. External covers job boards, agency fees, background checks, relocation and career fairs. Internal covers recruiter and sourcer time, referral bonuses, and your ATS and recruiting tooling.
It excludes interviewer panel time at most companies, hiring manager hours, candidate travel and onsite logistics, the vacancy cost of the role sitting open, onboarding and ramp to productivity, and the cost of a mis-hire. That is why the published figure should be read as a floor rather than as the true cost of a hire.
There is no single good number, because the answer depends almost entirely on channel mix and seniority. A referral-heavy team hiring mid level roles will land far below a team using contingency agencies for the same seats. The useful comparison is your own figure from last quarter, computed with the same definition, not a national average.
The standard contingency structure is a percentage of annual CTC: about 8.33% for entry level and bulk hiring, which equals one month's salary, 12.5% for mid level and specialised roles, and 16.67% for senior or niche roles. On a ₹15 lakh CTC hire that is roughly ₹1.25 lakh to ₹2.5 lakh. Retained executive search is priced separately and typically runs 25% to 35% of first-year compensation.
The 2025 SHRM figure for executive hires is $35,879, nearly seven times the non-executive average of $5,475. Search fees are a percentage of a much larger salary, the panel is more senior and therefore more expensive per hour, and the process runs longer. Even that figure understates the total, because it is direct spend only.
Count joins. Dividing by offers extended makes your cost per hire improve every time a candidate declines, which rewards exactly the wrong outcome. Pick joins, write the definition down, and keep it identical across quarters even when a quarter looks bad.
It can, but mostly by shifting cost rather than removing it: less agency spend and fewer recruiter screening hours, traded against a software subscription. Whether that nets out positive depends on your current channel mix, and it will not show up at all if your reported cost per hire excludes internal recruiter time, since that is where most of the saving lands.
Quarterly is the right cadence for most teams. A single quarter contains too few hires to be stable, particularly for senior roles, and monthly reporting invites noise-chasing. Four quarters of consistently computed data is what turns the metric into a trend you can act on.
No, and this is the metric's biggest weakness. Cost per hire is trivially easy to improve by hiring worse people faster, so it should never be read without a quality signal such as first-year retention or hiring manager satisfaction beside it. The downside of a bad hire is larger than anything you will save on sourcing spend.


