
Recruitment Funnel Conversion Rates: What Good Looks Like at Every Stage in 2026
Verified benchmarks for each hiring stage, and how to find the one that is leaking.
Recruitment funnel conversion rates by stage: about 2 to 3% of applicants reach interview, 27% of interviewees are hired, and 73 to 84% of offers are accepted.

TL;DR
Recruitment funnel conversion rates are lower and noisier than most teams assume. CareerPlug's 2025 report, covering more than 10 million applications to small businesses, found that roughly 2 to 3% of applicants reach an interview and about a quarter of interviewees are hired, at around 180 applicants per hire. There is no universal benchmark, only a range per stage, and the number that matters most is how your own funnel moves month to month. Treat published rates as a sanity check and your own baseline as the target. If your funnel stalls after the interview, start with our look at the hiring manager bottleneck.
What is actually happening
Most funnel benchmark articles quote tidy percentages, and most of those percentages trace back to a handful of datasets. Three are worth knowing. CareerPlug's 2025 Recruiting Metrics Report draws on more than 10 million applications to small businesses. Gem's 2025 benchmarks cover January 2021 to December 2024 and a very large applicant base. Greenhouse reported in August 2026 that its platform sees about 254 applicants per job ad.
The direction of travel is consistent. Gem found that interviews per hire rose from 14 in 2021 to 20 in 2024, and average time to hire rose from 33 to 41 days. Over the same three years, open requisitions per recruiter rose 56% to 14, and applications per recruiter rose 2.7 times to more than 2,500. Greenhouse's CEO, Daniel Chait, told Fortune that applications per recruiter are up 412%, though no baseline period was stated.
Put plainly, the top of the funnel got wider while the team operating it got smaller. Gem reports that average recruiting team headcount fell from 31 in 2022 to 24 in 2024. More applicants per recruiter means each applicant gets less human attention, which is a large part of why early-stage rates look so low.
Two cautions on the data. These are vendor datasets, so they skew toward companies that already use applicant tracking software, and the definition of a "stage" differs between platforms. Even CareerPlug's own page quotes slightly different figures in different places (2% and 3% for application to interview, 26% and 27% for interview to hire), which is why this post uses ranges rather than single numbers.
The numbers
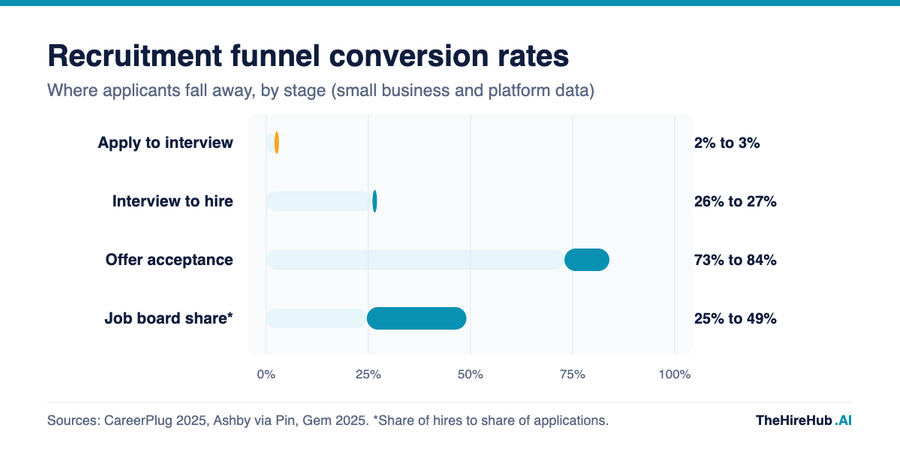
The chart below puts the verified stage rates on one axis. Each bar is a range because sources differ or segments differ, not because the data is vague.
How to read this
- Application to interview is the steep drop. Roughly 2 to 3% of applicants are invited to interview in CareerPlug's data, and about 27% of those interviewed are hired. The overall average is about 180 applicants per hire, with automotive near 234 and education and childcare near 57.
- Offer acceptance is the healthiest stage, but it varies by role. Ashby data cited by Pin (labelled 2023) shows 84% for business roles and 73% for technical roles, and Gem puts the overall rate at 84%, up from 81% in 2021. Our guide to offer acceptance rate covers what moves it.
- Source matters more than stage. Gem found that job boards and social sites made up 49.0% of applications but only 24.6% of hires, while sourced candidates were five times more likely to be hired than inbound applicants.
How it actually works, and where it breaks
A funnel conversion rate is the number of candidates who reach the next stage divided by the number who reached the current one, within a fixed window. The arithmetic is trivial. The trouble is that every input is a judgement call: what counts as an applicant, when a candidate counts as screened, and whether a candidate who withdraws is recorded as rejected.
A worked example shows why the definitions matter. Take 1,000 applicants to a role, of whom 250 are ineligible on basic criteria. At 3% of all applicants, 30 reach interview. Measured against the 750 eligible applicants, the same 30 interviews are 4%. Nothing about your screening changed, but the story you tell your hiring manager did. (This is illustrative arithmetic, not a benchmark.)
The first failure mode is the denominator problem. If a job ad draws 254 applications and 200 are mass applications from people who do not meet basic eligibility, your 2% screen rate describes your job ad, not your screening. Strip out clearly ineligible applicants before you compute anything, and report both versions of the rate.
The second is cohort timing. Conversion measured on everyone who applied this month mixes candidates who finished the process with candidates still in it, so late stages look worse than they are. Measure by application cohort, and wait until the cohort has resolved before you judge it.
The third is averaging across unlike roles. The funnel for a high-volume support role and the funnel for a senior engineer have almost nothing in common, and a blended rate hides which one is broken. Split by role family before you do anything else.
One more risk comes from automation itself. A screen that rejects too aggressively makes your application-to-interview rate look efficient while quietly removing qualified people, a problem we unpack in AI screening false negatives.
"A funnel rate with no stage definition behind it is just a number someone typed into a slide."
What this means for your team
The sequence matters more than the tooling. The chart below shows a five-step review that a small team can run alongside normal hiring, and the list underneath says what each step involves.
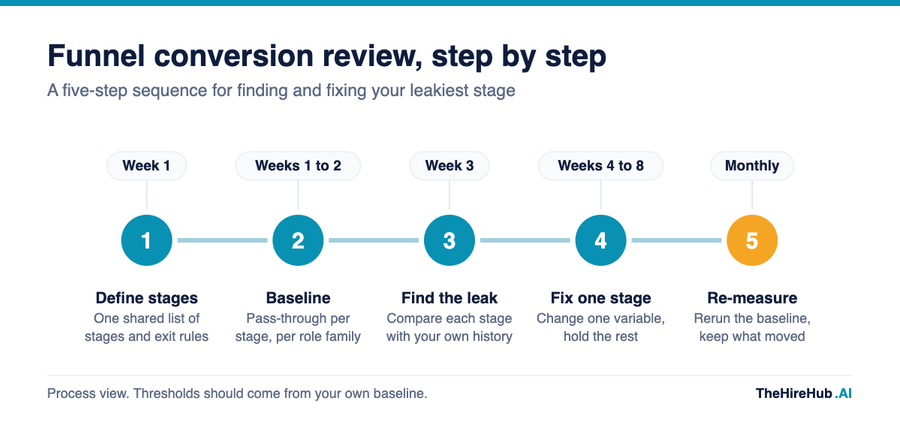
- Define stages. Agree one list of stages (applied, screened, interviewed, offered, accepted, joined) and one exit rule for each, so two recruiters would classify the same candidate the same way.
- Baseline. Pull 90 days of data per role family and compute pass-through for every stage, using application cohorts rather than calendar months.
- Find the leak. Compare each stage with your own history first and with published ranges second. A stage far below your own history is a stronger signal than one that is merely below someone else's benchmark.
- Fix one stage. Change a single variable, such as a screening question, a scheduling rule, or an offer step, and hold everything else still. Otherwise you cannot tell what worked.
- Re-measure. Rerun the baseline monthly, keep changes that moved a rate, and drop the ones that did not.
Ownership matters at every step. Each stage should have one named owner, whether that is a recruiter, a hiring manager, or an approver, because a rate with no owner is a rate nobody changes. Share the stage rates with hiring managers in the same format every month, and keep the conversation on the stage, not on individuals. When managers see that interview to hire is where candidates are lost, the conversation about calibration and speed becomes concrete instead of political.
The timeline assumes an applicant tracking system that can export stage history. If yours cannot, week one becomes a spreadsheet exercise, which is perfectly acceptable. Resist the pull to start at the top of the funnel by buying more applicants. Gem's finding that sourced candidates are five times as likely to be hired suggests the quality of entry matters more than volume, but that only pays off once you know which stage is actually failing.
Funnel conversion vs the alternative
Many teams track end-to-end numbers instead, chiefly time to hire and cost per hire. Those are outcomes, while stage conversion is the diagnosis. Time to hire (41 days on average in Gem's 2024 data) tells you the process is slow, but it cannot tell you whether the delay sits in scheduling, in interviews, or in offer approval.
There is also a planning use that outcome metrics cannot serve. If you know that roughly 180 applicants lead to one hire in your segment, or that your own ratio is double that, you can estimate how much sourcing a hiring plan needs before the requisitions open. That turns the funnel from a rear-view report into a forecast, which is the form finance and the founders actually want.
Our time to hire benchmarks cover the outcome side, and our cost per hire benchmarks cover the spend. Use conversion rates to decide where to act, and the outcome metrics to confirm that acting worked.
How to actually do this (and the four traps)
- Chasing a single benchmark. A published number is an average across companies, roles and definitions you do not share. Use it to check that your results are plausible, then manage against your own trend.
- Optimising one stage in isolation. Loosening screening criteria lifts application to interview and then tends to depress interview to hire. Always read adjacent stages together.
- Ignoring the offer stage. An 84% acceptance rate still means roughly one offer in six is declined, and for technical roles at 73% it is closer to one in four. A leak there wastes every stage of effort that came before it.
- Counting activity instead of outcomes. Funnel rates say nothing about whether the people you hired performed. Pair them with a working definition from our guide to quality of hire measurement.
"Fix the stage that leaks the most qualified people, not the stage that is loudest in the weekly meeting."
The one thing every hiring leader should take from this
Benchmarks tell you what other companies' funnels look like, and your own history tells you what yours is doing. The leaders who improve hiring are rarely the ones with the best tool. They are the ones who defined their stages, wrote the numbers down, and changed one thing at a time. Pick one role family this week, compute the stage rates, and find the stage that has moved most against its own history, because that is where your next month should go. If you want a second pair of eyes on your funnel, we look at this stuff all day.
Frequently Asked Questions
There is no single good rate, because definitions and roles differ. Published small business data suggests roughly 2 to 3% of applicants reach an interview, about 27% of interviewees are hired, and 73 to 84% of offers are accepted. Use those as plausibility checks and manage against your own trend by role family.
CareerPlug's 2025 Recruiting Metrics Report, based on more than 10 million applications to small businesses, puts it at roughly 2 to 3%. The figure falls as applications per job rise, so high-volume roles sit at the low end.
CareerPlug reports about 27% of interviewed candidates are hired, slightly down year on year, with a nearby figure of 26% quoted elsewhere in the same report. That is roughly one hire for every four interviews, though Gem's data shows interviews per hire rising to 20 in 2024 for its customer base.
CareerPlug's 2025 data averages about 180 applicants per hire, ranging from about 57 in education and childcare to about 234 in automotive. Greenhouse reported in August 2026 that its platform sees about 254 applicants per job ad, so the ratio depends heavily on how many hires each posting produces.
Gem reports an overall acceptance rate of 84%, up from 81% in 2021. Ashby data cited by Pin (labelled 2023) shows 84% for business roles and 73% for technical roles, so a technical team should not benchmark against the business figure.
Divide the number of candidates who reached a stage by the number who reached the stage before it, for a fixed cohort of applicants. Remove clearly ineligible applicants first, report both versions, and wait until the cohort has resolved before you judge it.
The usual causes are different stage definitions, an inflated applicant count that includes ineligible or duplicate applications, and blending unlike roles into one rate. Check those three before you assume your process is underperforming.
Gem's 2025 benchmarks found that sourced candidates were five times more likely to be hired than inbound applicants, and that job boards and social sites made up 49.0% of applications but only 24.6% of hires. Sourcing costs recruiter time, so weigh the conversion gain against capacity.
Monthly, by application cohort, is a sensible rhythm for most teams. Weekly numbers on small samples swing too much to act on, and quarterly reviews let a leak run for too long.
It can speed up stages such as scheduling and first screening, which may help with time to hire. It can also hide problems if it rejects qualified people, so track stage rates before and after any change and sample rejected candidates for false negatives.

