
Recruitment Automation ROI in 2026: Break-Even Hires, Payback Timing and When It Fails
What a hiring volume must reach before automation repays its cost, when returns show up, and the traps that sink the business case.
Automation pays back when hiring volume clears break-even, roughly 3 to 53 hires a year for mid-market tools. Here is the payback maths, the timeline and the failure modes.

TL;DR
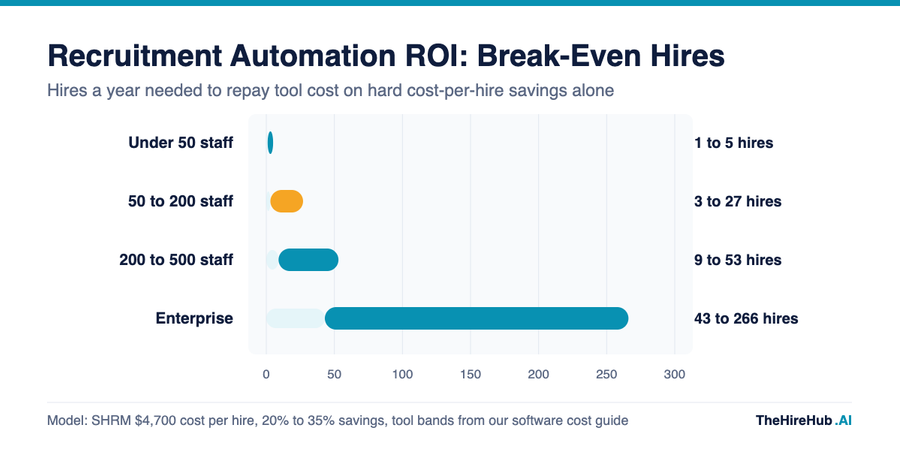
Recruitment automation ROI is a volume question before it is a technology question. On hard cost-per-hire savings alone, a mid-market tool breaks even at roughly 3 to 53 hires a year depending on its price, while a team under 50 staff needs only 1 to 5 and an enterprise rollout needs 43 to 266. Below those volumes the tool rarely repays itself, and above them the real risk is not the maths but whether anyone measures it. For the cost side of the sum, start with our AI recruiting software cost guide.
What is actually happening
Return on investment is the most quoted and least tested number in recruiting technology. Figures of 300 to 500 percent in the first year circulate in vendor and aggregator material, and a recent HeroHunt review of the evidence advises treating them as estimates to be flagged or excluded.
For founders the practical reading is simple. If a vendor leads with a headline return and cannot explain how it was measured, the number is marketing. If they can show a control group, a time frame and a hiring volume, you have something to test against your own figures.
The testing gap is wide. The same review reports that only 8 percent of teams claiming an AI recruiting return used a control group or A/B test, a figure it attributes to Recruiting Tech Reviews. Most claimed savings are therefore before and after comparisons, which mix the tool's effect with seasonality, hiring volume and a dozen other changes.
The baseline being improved is itself modest. SHRM benchmarking reported in 2022 put the average cost per hire at nearly $4,700, and that is a cash figure only. Edie Goldberg of E.L. Goldberg and Associates told SHRM that many employers estimate the total cost of a hire at three to four times the position's salary once soft costs are counted.
Meanwhile, projects fail for dull reasons. Gartner predicted that at least 30 percent of generative AI projects would be abandoned after proof of concept by the end of 2025, citing poor data quality, weak risk controls, rising costs and unclear business value. Recruiting is not exempt from any of those four.
Our own guide to recruitment automation covers what to automate. This post asks the narrower question that comes next: at what volume does it repay the money, and how long before you can prove it.
The numbers
The cleanest way to test a business case is to ask how many hires a tool must influence before it pays for itself. We took the annual price bands from our software cost guide and divided them by the saving per hire, using SHRM's $4,700 cash cost per hire and an assumed saving of 20 to 35 percent. That range is the commonly cited band in recent reviews, and it is directional, not measured.
The result is a break-even hiring volume for each tier. Small teams clear it with a handful of hires, mid-market teams need somewhere between 3 and 53 depending on the contract, and enterprise deployments need dozens to hundreds because the contract and implementation costs scale faster than the saving per hire.
A worked example makes it concrete. Take a 100 person company paying around $15,000 a year for a tool. At a 27 percent saving on a $4,700 hire, each hire saves roughly $1,270, so the tool needs about 12 hires a year to cover its price.
How to read this:
- The model counts hard cost-per-hire savings only, so it ignores recruiter hours recovered, faster fills and quality of hire, all of which can make payback quicker.
- The wide enterprise range reflects price spread, not uncertainty about savings, so ask vendors for the contract figure and rerun the sum.
- If your annual hires sit below the low end of your tier, the tool needs an argument other than cost, such as speed or coverage.
How it actually works, and where it breaks
Automation returns value in three places: lower cash cost per hire, recruiter time moved from admin to judgement, and shorter time to fill. Only the first is easy to measure, which is why most business cases lean on it. The others are real but depend on what the freed time is used for.
The first failure mode is no baseline. Teams switch a tool on, then try to reconstruct what the previous quarter looked like, and end up comparing against memory. Without a recorded cost per hire, time to fill and quality of hire, no later number can be called a return.
The second is volume. A team making twelve hires a year on a contract that needs thirty is paying for capacity it will never use, however good the software is.
The third is the stalled rollout. If implementation drags, as covered in our guide to AI recruiting implementation time, the payback clock keeps running while the savings have not started.
The fourth is the invisible cost. Candidates screened out wrongly, a point we raise in AI screening false negatives, do not appear on the cost line but do reduce the quality of the hires that follow.
Together these explain why two companies buying the same tool can report opposite results. The difference is rarely the product. It is whether the buyer had the volume, the baseline and the patience to wait for the evidence.
"Savings you cannot trace to a control group are a forecast, and a forecast is not a return."
What this means for your team
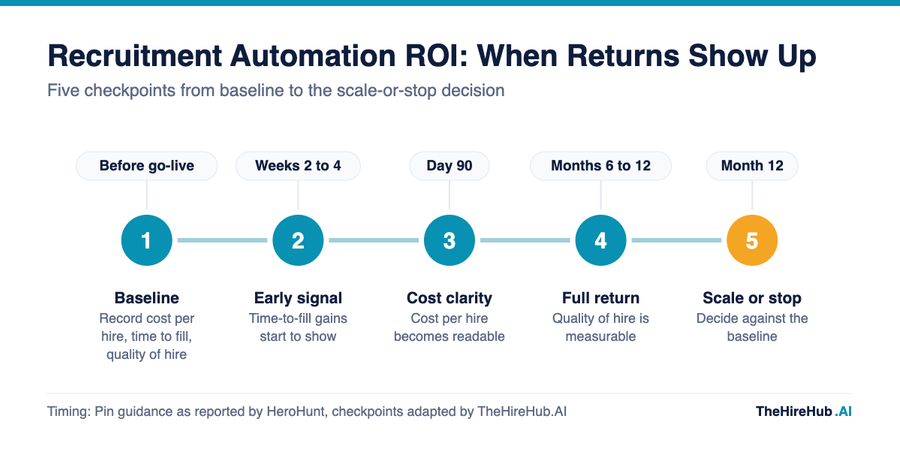
Proving a return is a sequence of checkpoints, and each one answers a different question. The guidance summarised by HeroHunt, which it attributes to Pin, is that time-to-fill gains appear within 2 to 4 weeks, cost-per-hire clarity arrives at about 90 days, and a full return including quality of hire takes 6 to 12 months.
Each checkpoint also needs an owner. Talent acquisition should own the baseline, finance should sign off the cost figure, and a hiring manager should confirm that quality looks the same or better. Splitting the ownership stops the recruiting team from marking its own homework.
Start before go-live by recording three numbers: cost per hire, time to fill and a quality measure such as first-year retention. These are the baseline every later claim is judged against.
At weeks 2 to 4, look only at time to fill, because it moves first. At day 90 you have enough closed roles to read cost per hire with some confidence, though a quiet quarter can still mislead.
At 6 to 12 months, test quality of hire, then make an explicit decision to scale, renegotiate or stop. Treat that decision as a real option, not a formality.
Automation ROI vs the alternative
The honest comparison is not automation against nothing. It is automation against the other ways of buying the same capacity: an agency, an extra recruiter, or simply living with the backlog. Agency fees in our market run at 4 to 25 percent of first-year CTC, which is why the break-even for software looks short against a heavy agency habit, as set out in our comparison of AI recruiting vs agency.
An extra recruiter changes the sum again. A hire adds judgement and relationship work that software cannot, but also fixed salary cost whether volume holds or not. Software is the cheaper option when demand is steady and repetitive, and the weaker one when roles are rare and senior.
Put differently, automation wins on volume and agencies win on difficulty. Most teams that measure honestly end up using both.
There is also a middle path. Some teams automate high volume, repeatable roles and keep agencies for leadership and niche technical searches. That split lets each option work where its economics are strongest, and it gives you a cleaner test of what the software alone is worth.
How to actually do this (and the four traps)
Run the break-even sum first, record the baseline second, and only then sign a contract. These are the four traps that most often turn a sensible purchase into a disputed one.
- Trusting vendor ROI. A promised first-year return is a sales forecast built on the vendor's assumptions, not yours. Rebuild the sum with your own hiring volume and your own cost per hire.
- Skipping the control. Run the tool on some roles and not others for a quarter if you can. Without a comparison group you cannot separate the tool from the season.
- Measuring only cash. Cost per hire is the easy number, but quality of hire decides whether you saved money. Pair it with the measures in our AI hiring metrics guide and our note on quality of hire measurement.
- Buying for peak volume. Contracts sized for your busiest quarter get paid for in the other three. Negotiate on typical annual hires and add capacity as it is proved.
None of these traps needs new technology to fix. They need a calendar, a spreadsheet and a willingness to compare results against a number you wrote down before the tool went live.
"A tool that pays back on paper but never changes how managers decide has simply bought you a faster queue."
The one thing every hiring leader should take from this
Automation pays back when volume clears break-even and when someone has measured the starting point, and it fails quietly when either is missing. The technology is rarely the deciding factor. The deciding factor is whether you can show, at day 90 and again at month 12, what changed against a baseline you wrote down in advance.
Before your next vendor call, write down your annual hires, your current cost per hire and the break-even volume for the contract on the table. If the first number is below the third, you have your answer before the demo starts. If you want a second pair of eyes on that sum, we look at this stuff all day.
Frequently Asked Questions
It depends on hiring volume and contract price. On cash savings alone a mid-market tool needs roughly 3 to 53 hires a year to break even, and the first visible signals, such as faster fills, typically appear within 2 to 4 weeks of go-live.
Recent reviews cite a 20 to 35 percent cut in cost per hire as a directional range, while 300 to 500 percent first-year ROI figures are mostly vendor estimates. Treat any figure as a hypothesis until you test it against your own baseline.
Divide the annual tool and implementation cost by the saving per hire to find break-even hires, then compare that with your real annual hiring volume. Add recovered recruiter hours and faster fills as a second layer once the cash case holds.
SHRM benchmarking reported in 2022 put the average at nearly $4,700 in cash costs. Many employers estimate the full cost, including soft costs, at three to four times the position's salary.
It struggles when annual hiring volume sits below the contract's break-even, when there is no recorded baseline, when the rollout stalls, or when the roles are rare and senior enough that human search does the real work.
Not strictly, but it is the strongest evidence. Only 8 percent of teams claiming an AI recruiting return used a control group or A/B test, so most claimed savings cannot be separated from seasonality and volume changes.
Record a baseline before go-live, check time to fill at weeks 2 to 4, read cost per hire at about day 90, and test quality of hire at 6 to 12 months. Make a scale, renegotiate or stop decision at month 12.
For steady, repeatable hiring it usually is, since agency fees run from 4 to 25 percent of first-year CTC in our market. For rare or senior roles agencies often remain the better value.
Gartner predicted at least 30 percent of generative AI projects would be abandoned after proof of concept by the end of 2025, citing poor data quality, weak risk controls, rising costs and unclear business value.
Time to fill, recruiter hours spent on admin, candidate drop-off and quality of hire, such as first-year retention. Cost per hire alone can look good while hiring quality falls.

