
AI Hiring Metrics in 2026: The Seven Numbers a TA Leader Should Actually Run
Your dashboard measures the funnel. The automation now makes the first cut, and almost nobody is measuring that.
Time to hire and cost per hire describe recruiter throughput, not the model making your first cut. The seven AI hiring metrics to run in 2026, and the order to build them in.

Summary
AI hiring metrics are the numbers that describe what your automated screening layer is doing to your candidate pool, not how fast your recruiters are working. The seven worth running in 2026 are screen-out rate, human override rate, impact ratio, review latency, source-to-screen precision, offer acceptance by channel, and 90-day retention of AI-screened hires. Start with override rate and impact ratio, because those are the two a regulator or a plaintiff's lawyer asks for first, and the two almost nobody has. If you fix only one measurement problem this quarter, make it quality of hire measurement.
- Time to hire is a weak signal. It runs 18 to 28 days in retail and hospitality against 40 to 48 in financial services, and SHRM's 2025 median time to fill is 44 days, so a six-day move is usually noise.
- Application volume tripled, dashboards did not. The average opening now draws more than 300 candidates, roughly three times the 2021 baseline, per Ashby data covering more than 100 million applications.
- Impact ratio is the number regulators ask for. The EEOC's four-fifths rule treats a selection-rate ratio below 0.80 as evidence of adverse impact, and it is computable from data you already hold.
- Almost nobody can measure quality of hire. LinkedIn finds 89 percent of TA professionals say it matters more each year, while only about 25 percent are confident their organisation can measure it.
- A zero override rate is a warning, not a win. It usually means recruiters stopped reviewing AI rejections rather than that the model is right.
What is actually happening
The volume side of hiring changed faster than the measurement side. The average job opening now attracts more than 300 candidates, roughly triple the 2021 baseline, according to Ashby data covering more than 100 million applications. LinkedIn now receives around 11,000 applications every minute, a 45 percent jump in a single year. That is not three times as many people looking for work, it is the same people with better tools applying to far more roles.
Teams responded the obvious way: they bought screening automation. Most of it works. Roughly 8 percent of applicants now pass initial screening, and the median outcome across the funnel is about one offer per 200 applications.
Here is the problem. The dashboard did not change when the process did. Time to hire, cost per hire and offer acceptance are still the headline numbers on most TA reports, and all three now measure a system that is mostly software. When your time to hire drops from 52 days to 41, you genuinely cannot tell from that number whether your screening got smarter or simply got faster at rejecting people.
Cost per hire has the same defect. SHRM's 2025 benchmarking puts non-executive cost per hire at $5,475 and executive cost per hire at $35,879, and median time to fill at 44 days. Those are useful industry anchors. They tell you nothing about whether the model doing your first pass is rejecting qualified people.
Meanwhile a second set of numbers arrived from outside the function. NYC Local Law 144 requires an annual independent bias audit of automated employment decision tools, a published summary of the results, and at least 10 business days of notice to candidates. The EU AI Act lists recruitment, CV filtering and candidate ranking as high-risk under Annex III, Section 4, with obligations covering logging, record keeping and effective human oversight. The application date for those Annex III obligations was recently pushed from 2 August 2026 to 2 December 2027 under the AI Digital Omnibus agreement, which buys time but does not change the requirement.
So there are now two scoreboards. The one most teams run describes recruiter throughput. The one that determines legal exposure and actual hire quality describes model behaviour, and hardly anyone is running it.
The numbers
Before adding new metrics, it helps to see how noisy the old headline one already is. Time to hire varies more by industry and role than by anything a recruiting team controls, which is exactly why it is a poor measure of whether your automation is working.
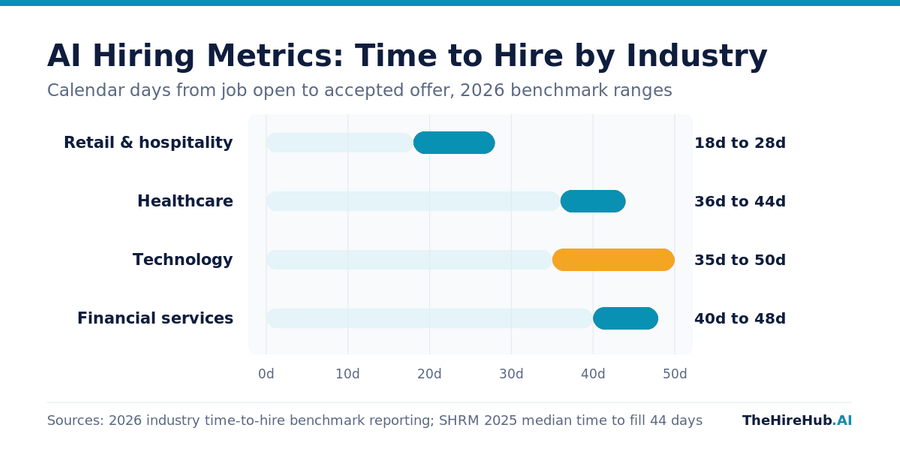
Three things to take from this:
- The spread within a single industry (technology runs 35 to 50 days) is wider than the gap between most industries, so a 6-day improvement is usually noise, not signal.
- Sector mix explains most of the variance. If your requisition mix shifts toward engineering, your time to hire rises whether or not anything got worse.
- The all-industry median of 44 days from SHRM's 2025 data is a sanity check, not a target. Beating it by cutting review depth is trivially easy and usually expensive later.
Offer acceptance behaves the same way. Interview-to-offer conversion runs roughly 27 to 36 percent, and acceptance sits around 82 percent overall, the highest since 2021, but splits to about 73 percent for technical roles against 84 percent for business roles. Reporting a single blended acceptance number across both hides the only movement worth acting on.
How it actually works, and where it breaks
An AI screening layer does one thing: it converts an unranked pile into an ordered shortlist, then applies a cut. Everything worth measuring flows from that cut. The screen-out rate tells you how aggressive it is. The human override rate, meaning the share of AI-rejected candidates a recruiter pulls back in, tells you whether anyone is checking.
The first failure mode is silent drift. Models get retrained, thresholds get nudged, a new job description template lands, and the screen-out rate moves five points without anyone noticing. Because time to hire improves when screening tightens, the headline dashboard shows the drift as good news. This is the single most common way a hiring funnel degrades without anyone raising a flag.
The second failure mode is the one the regulators care about. The four-fifths rule, codified in the EEOC's 1978 Uniform Guidelines, holds that the selection rate for any protected group should be at least 80 percent of the rate for the most-selected group. That ratio, the impact ratio, is computable from data you already have. Most teams have simply never computed it, and discover the number for the first time during an audit or a complaint.
The third is measurement theatre. Teams add a quality of hire score, define it as hiring manager satisfaction at 90 days, and stop. LinkedIn's research finds 89 percent of TA professionals agree quality of hire is becoming more important while only about 25 percent are confident their organisation can measure it. The most-used methods are performance ratings (66 percent), new hire retention (60 percent) and hiring manager satisfaction (44 percent), which is a survey, a lagging indicator, and a survey.
"A screening system that nobody overrides is not a system that is always right, it is a system that nobody is checking."
What this means for your team
You do not need a data team to start. You need four weeks, read access to your ATS, and a willingness to look at rejections rather than hires. The sequence below is deliberately ordered so that the cheapest, highest-signal numbers land first.
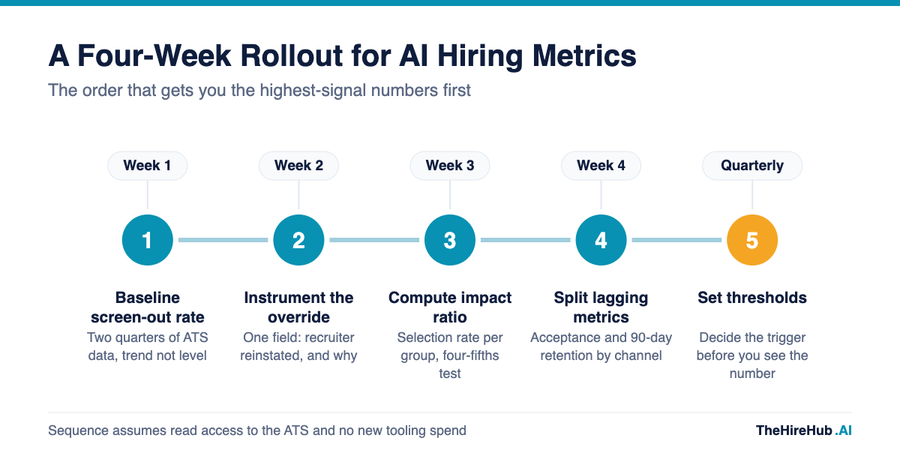
Run it in this order:
- Baseline the screen-out rate. Pull the last two quarters and calculate what share of applicants the automated pass rejected before a human saw them. You want the trend line, not the number.
- Instrument the override. Add a single field that records when a recruiter reinstates an AI-rejected candidate, and why. If your override rate is zero, that is a finding, not a pass.
- Compute the impact ratio. Selection rate per demographic category, divided by the rate of the most-selected group. Do it on your own candidate data, not the vendor's validation set.
- Split the lagging metrics by channel. Offer acceptance and 90-day retention, broken out by whether the candidate was AI-screened or recruiter-sourced. This is where AI recruitment ROI either shows up or does not.
- Set a quarterly review and a threshold. Decide in advance what movement triggers action, and write it down before you see the next number.
AI hiring metrics vs the recruiting dashboard you already have
This is not a replacement for your existing reporting, and pitching it that way is how the project dies. Your funnel dashboard answers a resourcing question: how many recruiters do we need, and where is the bottleneck. The AI hiring metrics above answer a different question: is the automated layer making decisions we would defend.
The practical distinction mirrors the difference between ATS vs AI recruiting software. An ATS records what happened, so its metrics are historical and descriptive. A screening model decides what happens, so its metrics have to be diagnostic, and they need to include the candidates who never made it into the pipeline at all. Those people are invisible on every funnel report ever built, and they are precisely where AI screening false negatives live.
How to actually do this (and the four traps)
- Do not let the vendor supply the numbers. Vendor accuracy figures come from validation sets, not your applicant pool, and a model that scores well on a benchmark can behave very differently against your actual job descriptions. Compute impact ratio and screen-out rate from your own ATS export, every quarter, on your own data.
- Do not report a blended quality of hire. A single company-wide score averages away every difference that matters: role family, seniority, sourcing channel, whether the hire was AI-screened. Split it or skip it.
- Do not treat a zero override rate as success. It almost always means recruiters have stopped reviewing rejections, not that the model is perfect. Fixing this is mostly a workflow question, and the shape of the answer is covered in human in the loop hiring.
- Do not measure the machine and ignore the person. Faster screening with a worse experience is a net loss you will only see two quarters later in acceptance rates, which is the case made in candidate experience in AI hiring.
"The metrics that protect you are the ones about people your process rejected, and those are the numbers no dashboard shows you by default."
The one thing every hiring leader should take from this
Your current dashboard was designed for a process where humans made the first cut. They no longer do. Until you are measuring the screen-out rate, the override rate and the impact ratio, you are reporting on a hiring process you cannot actually see, and the first time anyone looks closely will be the worst possible moment to find out. Pick two of the seven, baseline them this month, and put a threshold next to each. TheHireHub builds this instrumentation into hiring workflows because it is the part teams consistently skip.
Hiring shouldn't have to feel harder just because the talent market is more competitive.
At TheHireHub.ai, we help hiring teams simplify the process from finding the right candidates to assessing and ranking them, so your team can spend less time managing the hiring process and more time making the right decisions.
If you're looking to make hiring easier, faster, and better, we'd be happy to help.
Frequently Asked Questions
AI hiring metrics are the numbers that describe what an automated screening or ranking layer is doing to your candidate pool, as distinct from funnel metrics that describe recruiter throughput. The core set is screen-out rate, human override rate, impact ratio, review latency, source-to-screen precision, offer acceptance by channel, and 90-day retention of AI-screened hires. Funnel metrics like time to hire tell you how fast the process ran. AI hiring metrics tell you whether the decisions inside it were defensible.
Because tightening a screening threshold makes time to hire fall regardless of whether the screening got smarter. The metric also varies enormously by sector and role: retail and hospitality run roughly 18 to 28 days while financial services runs 40 to 48, and SHRM's 2025 benchmarking puts the median time to fill at 44 days. If your requisition mix shifts, the number moves without anything actually changing. Use it as a sanity check, not as evidence that automation is working.
The impact ratio is the selection rate for a given demographic group divided by the selection rate of the most-selected group. It comes from the four-fifths rule codified in the EEOC's 1978 Uniform Guidelines on Employee Selection Procedures, which treats a ratio of 0.80 or above as evidence that no disparate impact exists. You calculate it from your own ATS data, not the vendor's validation set. Note that the four-fifths rule is a rule of thumb rather than a precise legal standard, and at small sample sizes a ratio below 0.80 may not be statistically significant.
There is no published benchmark, and any vendor quoting one is guessing. What matters is that the number is not zero and that it is trending in a direction you can explain. A zero override rate almost always means recruiters have stopped reviewing AI rejections rather than that the model is perfect. Track it monthly and treat a sudden drop as a workflow problem to investigate.
The average opening now pulls more than 300 candidates, roughly triple the 2021 baseline, according to Ashby data covering more than 100 million applications. LinkedIn reports around 11,000 applications submitted every minute, a 45 percent increase in a single year. Roughly 8 percent of applicants pass initial screening and the median outcome is about one offer per 200 applications. The volume is driven mostly by the same candidates applying to far more roles with AI assistance, not by more people entering the market.
Local Law 144 requires an annual bias audit of any automated employment decision tool used on NYC-resident candidates, conducted by an independent auditor. The auditor calculates a selection rate for each demographic category and the impact ratio comparing each group to the most-selected group. Employers must publish a summary of the audit results and give candidates at least 10 business days of notice before the tool is used. A poor impact ratio is not automatically illegal under Local Law 144, but it can create exposure under Title VII and the NYC Human Rights Law.
Recruitment, CV filtering and candidate ranking are listed as high-risk under Annex III, Section 4 of the EU AI Act, which brings obligations covering risk management, data governance, technical documentation, logging, record keeping and effective human oversight. The application date for those Annex III obligations was moved from 2 August 2026 to 2 December 2027 under the AI Digital Omnibus political agreement. The extra time changes the deadline, not the substance, and the logging and human oversight requirements are the ones that take longest to build.
No. The first three metrics, screen-out rate, override rate and impact ratio, can all be computed from a standard ATS export in a spreadsheet. What you need is read access to rejection data and one new field recording when a recruiter reinstates an AI-rejected candidate. A data team helps once you start splitting lagging metrics like 90-day retention by sourcing channel, but nothing in the first four weeks requires one.
Quality of hire is a lagging outcome measure of whether the people you hired worked out. AI hiring metrics are mostly leading, diagnostic measures of how the automated layer behaved. LinkedIn's research finds that 89 percent of TA professionals say quality of hire is becoming more important while only around 25 percent are confident their organisation can measure it, and the common methods are performance ratings at 66 percent, new hire retention at 60 percent and hiring manager satisfaction at 44 percent. You need both, but the diagnostic metrics tell you where to intervene while there is still time.
Human override rate and impact ratio. Override rate is the cheapest early warning that your screening layer has stopped being reviewed, and it needs only one new field in your ATS. Impact ratio is the number a regulator, auditor or plaintiff's lawyer will ask for first, and computing it before someone else does is materially better than discovering it during an audit. Both can be baselined inside three weeks with existing data.


