
Headcount Planning Template for 2027: Attrition, Hiring Capacity and Cost in INR
The formulas, a worked INR example and four traps for Indian founders and TA leaders finalising their 2027 hiring plan.
Build a 2027 headcount plan that counts backfills, not just growth. Includes attrition and hiring capacity formulas, Aon India pay data and a worked example in INR.

TL;DR
A headcount planning template for 2027 comes down to one equation: opening headcount, plus net growth, plus backfills for attrition, equals the gross hires your recruiting team has to land. For Indian employers the input that moved most this year is attrition. Aon's India survey puts overall attrition at 18% in 2026, up from 16.2% in 2025, while its 2027 salary increase projection is 9.1%. A 400-person company that grows 10% therefore needs about 112 hires, not 40. Below are the template columns, the formulas, a worked example in INR and the traps, and once the plan is set, our recruitment budget planning guide prices the hires.
What is actually happening
Most headcount planning templates are built by finance software vendors for US teams. We read three of the pages that rank for this query as of November 2026, and none of them gave a formula for attrition, none showed how time to fill turns into recruiter workload, and none priced anything in rupees. That leaves an Indian founder or TA leader to adapt a spreadsheet designed for a different labour market.
The labour market itself has shifted. Aon's Annual Salary Increase and Turnover Survey for India 2026-27, published on 14 October 2026 and covering more than 1,200 organisations across 45 industries, reports overall attrition of 18% in 2026. The same release gives 17.1% for 2024 and 16.2% for 2025, so the 2025 dip has reversed.
Business Today, reporting on the earlier Aon data in March 2026, noted that roughly three quarters of attrition is voluntary, with voluntary attrition easing from 13.4% to 12% in 2025. Voluntary exits are the ones a manager can influence, but they are also the ones that arrive without warning. A plan has to carry a number for them regardless.
Pay is the other moving part. Aon projects a 9.1% average salary increase in India for 2027, against 9% actual in 2026. By comparison, SHRM's 16 November 2026 report on 2027 planning quotes Marsh data putting US salary increase budgets near 3.5%. Holding an Indian team flat in 2027 is not free: the payroll line grows by close to a tenth before anyone is hired.
One caution on hiring intent. SHRM cites The Conference Board finding that 31% of US employers expect headcount growth in 2027. We did not find a verified India equivalent from a primary source, so we do not quote one. Your own business plan is the better input for the growth line anyway.
Sector matters more than the average. Aon's release shows NBFCs at 10.1% and technology consulting and services at 6.6% for 2027, a gap of more than three percentage points. A single company-wide salary assumption therefore misprices some teams badly, which is why the template carries a sector or role-family line rather than one number.
The numbers
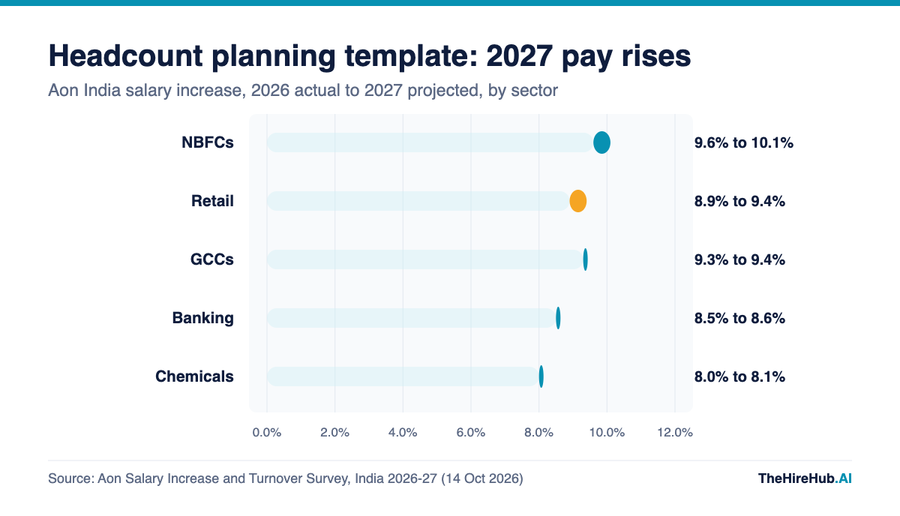
The chart below shows the pay side of the plan, using Aon's sector figures. These are the salary increase percentages that your backfills and new hires will be priced against. Compare them with the figure you assumed in last year's plan before you reuse the template. For wider context on volumes and speed, see our recruitment statistics India roundup.
How to read this chart
- The pale track runs from zero, the coloured marker spans the 2026 actual to 2027 projected range, so a thin marker means the sector expects almost no change.
- NBFCs lead at 10.1% for 2027, while Retail has the biggest projected step up, from 8.9% to 9.4%. Technology consulting and services sits lowest in Aon's list at 6.6% in both years, so it is not shown here.
- Use your sector line, not the 9.1% average, when you cost new hires. A GCC or NBFC plan and a chemicals plan should not share a salary assumption.
Sources and method
Salary increase figures come from Aon's India 2026-27 survey release dated 14 October 2026 (more than 1,200 organisations, 45 industries). The release does not state fieldwork dates or response rates, so treat 2026 attrition as Aon's reported figure rather than a final full-year audit. Time to fill and recruiter load come from SHRM benchmarking data, which does not state a country base. The US figures come from a SHRM article dated 16 November 2026. Nothing here is a projection we made ourselves.
How it actually works, and where it breaks
A usable template needs five columns per team: opening headcount, planned net change, expected leavers, gross hires, and in-year cost. The arithmetic behind them is short.
- Expected leavers = opening headcount x attrition rate, using your own trailing 12 month rate by team.
- Gross hires = expected leavers + net new roles. Backfills are hires too.
- Average open requisitions = gross hires x days to fill / 365.
- In-year cost = new roles x annual CTC x share of the year they are in seat.
How do you calculate gross hires for a headcount plan?
Add expected leavers to planned net growth. Expected leavers are opening headcount multiplied by your attrition rate. A 400-person team at 18% attrition loses 72 people, and 10% growth adds 40 roles, so the plan needs 112 gross hires. Most templates stop at the 40 and leave recruiting capacity short.
Where it breaks is predictable. First, a company-wide attrition rate hides the teams that actually leave, so sales and support often run far above engineering. Second, hires bunch in the first half of the year because leaders want people in seat early, which makes peak load much higher than the annual average. Third, the plan is approved once and never reconciled with actuals, so by the third quarter nobody trusts the number.
What does a 2027 headcount template need that a 2026 one did not?
Three additions. Phase hires by quarter so finance sees cash timing, carry a separate backfill line, and record a review date for each team. Attrition rose in 2026 and pay budgets are projected near 9%, so a template copied from last year will understate both volume and cost.
Add an assumptions tab as well, listing the attrition rate, average CTC band, time to fill and start-month rule behind every number. When a leader challenges the plan in the second quarter, you can change one assumption and show the effect, instead of rebuilding the sheet.
Claims check
Vendors sometimes quantify what better planning tools deliver. Set against independent benchmarks, those figures need a baseline before you can use them in a plan.
- Turnover reduction claim. Workday's headcount planning page says a workforce management system "can reduce turnover by 45% and save an average of $650,000 over 5 years" (page, checked November 2026). The page points to a buyer's guide and states no baseline rate, company size or period.
- What independent data implies. A 45% cut from Aon's 18% Indian attrition would mean about 9.9%. That is below even the 12.6% that one staffing executive told Business Today GCCs are near, so ask any vendor for a before and after rate from a named customer of your size.
"A headcount plan that ignores attrition is a hiring wishlist with a budget stapled to it."
What this means for your team
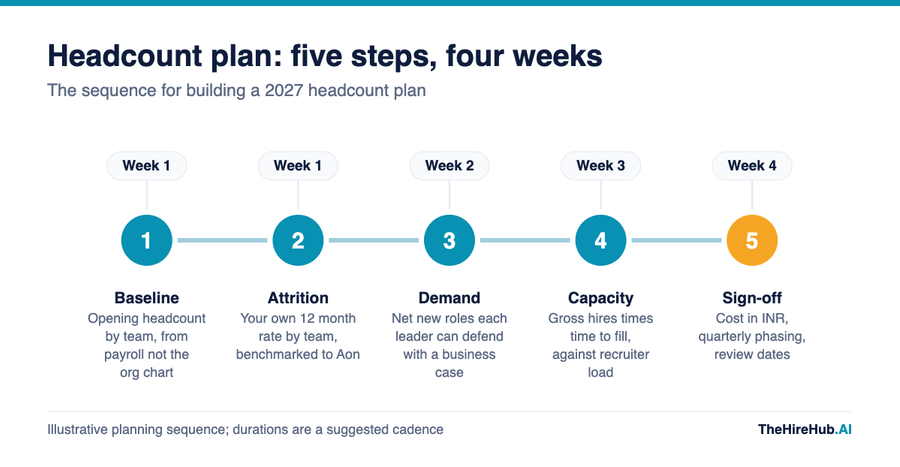
Run the plan as a four week sprint with finance in the room from the first day. The sequence below keeps the maths honest because each step feeds the next: baseline, attrition, demand, capacity, then cost and sign-off.
Weeks one and two belong to HR and finance. Pull opening headcount from payroll rather than the org chart, because open requisitions and contractors blur the chart, and ask each leader to justify new roles with a business case that names revenue, cost or risk. Week three is where recruiting joins, converting the gross hire number into requisitions by month. Week four is cost, phasing and sign-off.
Worked example: a 400-person Indian company
These figures are illustrative assumptions, not benchmarks. We assume an average annual CTC of ₹12 lakh and that new roles are in seat for half the year on average.
- Opening headcount: 400. Net growth of 10%: 40 new roles.
- Attrition at Aon's 18%: 72 leavers to backfill. Gross hires: 112.
- Payroll before hiring: ₹48 crore. A 9.1% increase adds about ₹4.37 crore.
- In-year cost of the 40 new roles at half-year: about ₹2.4 crore.
- Average open requisitions at 45 days to fill: 112 x 45 / 365 = about 14. At a first-half peak of 1.5 times, plan for about 21.
SHRM's benchmarking brief says time to fill is about a month and a half, and that over half of organisations have recruiters managing about 20 requisitions each. On those numbers, this plan fills one recruiter's desk at peak, with no slack for the 20 and 30 day cases. That is the conversation to have with finance in week three.
Headcount planning vs workforce planning
Headcount planning answers how many people, by team, by quarter, at what cost. Workforce planning answers which skills the company will need and where they come from, which is a longer and fuzzier horizon. Do headcount planning first and annually, and treat skills planning as the layer on top.
A common mistake is to buy a workforce planning platform when the real gap is a spreadsheet nobody reconciles. For a company of a few hundred people, a well-built sheet with the five columns above is enough, and a platform earns its place when many business units edit one plan.
The practical bridge between the two is capacity. Your recruiter to hire ratio decides how many of the planned hires can actually land in a quarter, and our recruiter to hire ratio guide shows how to set it. Your time to hire benchmarks tell you how early a requisition has to open to meet the in-seat date.
How to actually do this (and the four traps)
- Using one attrition rate for everyone. Build the rate by team and by tenure band. A blended 18% will understate support and sales and overstate engineering.
- Counting only net adds. Backfills are most of the volume in a high-attrition year. If the recruiting team sees only the 40, it is staffed for a third of the work.
- Pricing every hire at the average. Cost each role at its own band and its own start month, and check the result against cost per hire benchmarks before finance does.
- Buying tools before sizing the load. Automation changes time to fill and recruiter load, so size the plan first and then test what tooling would change, starting with ai recruiting software cost.
"The cheapest vacancy is the one you planned for a quarter before the resignation arrived."
The one thing every hiring leader should take from this
If you are finalising a 2027 plan this month, put the backfill number on the first line of the page, not the footnote. At current attrition, replacing leavers is likely to be the bigger share of your hiring, and it is the part nobody approves because it feels like business as usual. We built TheHireHub to take the load off recruiters when that volume arrives, but the planning discipline comes first: we look at this stuff all day.
Frequently Asked Questions
A headcount planning template is a spreadsheet that records, for each team, opening headcount, planned net change, expected leavers, gross hires needed and in-year cost. Its purpose is to turn a business plan into a hiring number and a budget, so recruiting capacity and finance approvals line up.
Gross hires equal expected leavers plus net new roles. Expected leavers are opening headcount multiplied by your attrition rate. For 400 people at 18% attrition with 10% growth, that is 72 plus 40, or 112 hires.
Use your own trailing 12 month rate by team first. As an external check, Aon's India survey reports overall attrition of 18% in 2026, up from 16.2% in 2025 and 17.1% in 2024. Sector rates vary, so benchmark against your industry.
Aon projects an average salary increase of 9.1% in India for 2027, against 9% in 2026. Sector projections range from 6.6% in technology consulting and services to 10.1% in NBFCs, so cost new hires against your own sector.
Three things matter in 2027. Attrition has turned up in India, salary budgets are projected slightly higher, and finance teams want plans phased by quarter with review dates. We did not find a verified India figure for 2027 hiring intent, so rely on your own business plan.
SHRM's recruiting benchmarking brief says over half of organisations have recruiters managing about 20 requisitions each. That is a benchmark, not a rule, and the region is not stated, so test it against your own role mix and sourcing difficulty.
SHRM's benchmarking data says time to fill is about a month and a half. Use your own ATS data by role family for the plan, because senior and niche roles run much longer than volume roles.
Quarterly is a sensible default: compare actual leavers and hires with the plan, update the attrition rate, and re-phase open roles. A plan that is only approved once a year drifts away from actuals within two quarters.
On our illustrative assumptions of ₹12 lakh average CTC, a 10% net increase costs about ₹2.4 crore in the first year if roles are in seat for half the year. A 9.1% pay increase on a ₹48 crore payroll adds about ₹4.37 crore.
Yes, as hires but not as new headcount. Backfills do not raise the headcount line, but they create recruiting workload, so they belong in the gross hires number that sizes your recruiting team.

